
Gold Price History: How to Read the Long View
By Kelvin BrattonPublished · Updated
Gold price history tracks a market reference over time. Understand nominal and inflation-adjusted comparisons, starting dates and bullion transaction costs.
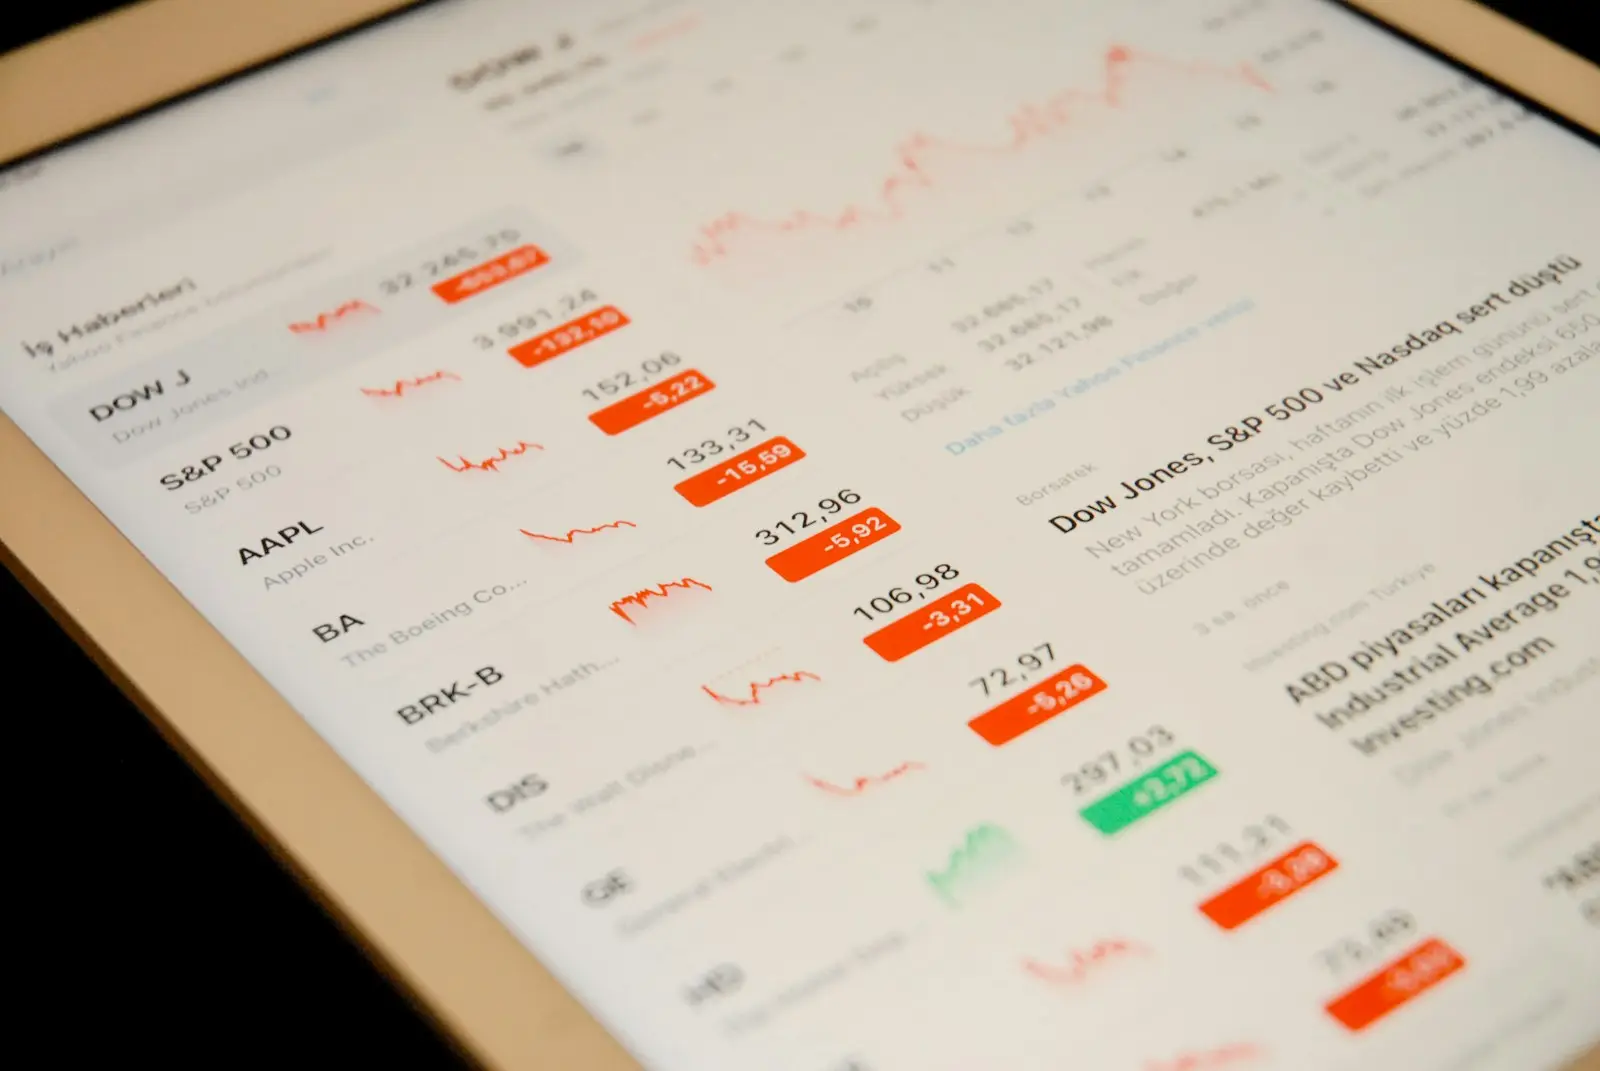
The starting date can change the story a gold chart tells. So can inflation, the end date and whether the chart includes purchase costs. Look at the journey between the endpoints, not just the difference between two numbers.
History includes difficult periods
Gold has risen and fallen over time. A line connecting distant dates can hide long stretches of disappointing performance along the way. Someone needing funds during one of those stretches experiences more than the eventual endpoint.
Physical bullion also includes costs outside the chart. The coin or bar's purchase price, any storage charges and the terms of selling affect the owner's result. A reference-price history is not a statement of personal returns.
Official conversion rates and market prices need different labels
An official dollar–gold conversion rate under an earlier monetary system was not the same observation as a modern retail coin price. Domestic changes in the 1930s and the end of foreign-official convertibility in 1971 altered different parts of that system. A continuous chart that crosses these periods needs its price-series definitions made clear.
The transition to floating exchange rates also unfolded over time. The 1971 suspension did not mean every international currency immediately adopted an identical new arrangement. Reading the historical policy stages helps keep a chart from turning a complicated transition into a single purchase signal.
Compare the experience, not only the endpoints
An increase between two selected dates can conceal declines and long waits within the interval. A different starting point changes the result. If a chart is being used to describe a holding period, look at the path as well as the beginning and end, and distinguish nominal results from an inflation-adjusted presentation.
Physical bullion adds purchase and selling terms, and possibly storage costs. Those are not part of a bare reference-price line. Use history to understand variability and challenge assumptions—not to replace the terms of the product you would actually acquire.
Review historical price changes and market risk
Historical prices can help you understand movement and test assumptions. They cannot show what comes next or establish that every buyer needs the same holding period.
If you are exploring gold, combine that perspective with a specific product conversation. LGS explains the purchase price, custody and selling process. Your advisers help assess the financial plan. A useful chart leaves you better informed, not certain of a future it cannot show.
Further Reading
This article is educational. It is not a recommendation to buy or sell anything, and it does not consider your circumstances. Prices can move in either direction.